Pictograph

Advertisement | Go Ad Free
Age: 7-11
Level: 2
Language: English (en)
ID: 790614
07/03/2021
Country code: BB
Country: Barbados
School subject: Math (1061955)
Main content: Pictographs (2011709)
From worksheet author:

Data Collection & Representation

Other contents:
Collecting Data
Worksheet description:
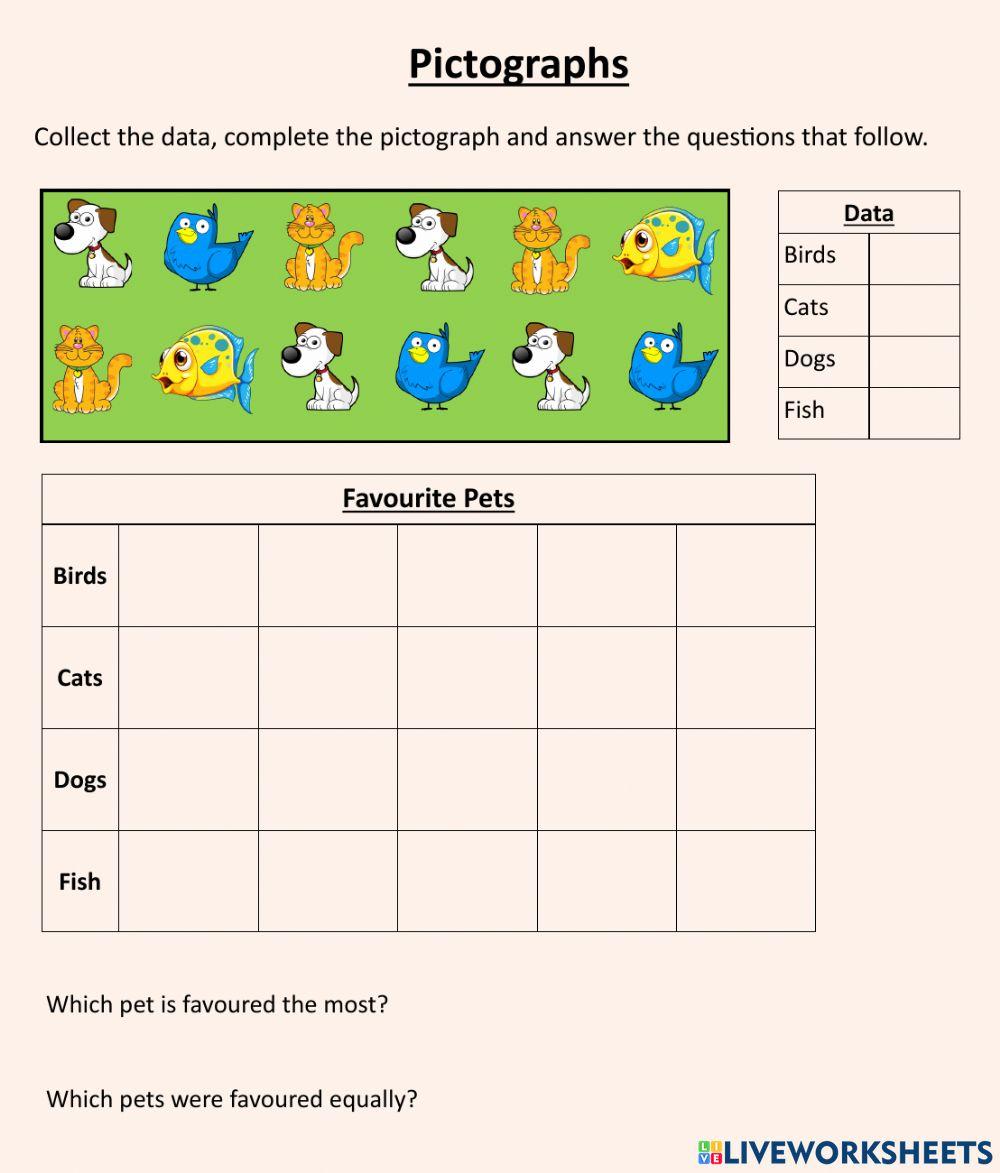
This worksheet, centered on the theme of Pictographs, is designed to enhance students' understanding of how to collect, represent, and interpret data graphically using pictographs. By focusing on a familiar and engaging topic, "Favorite Pets," students not only learn mathematical concepts but also apply them to everyday situations.

The main educational objective of this worksheet is to help students develop their ability to understand and create pictographs, a fundamental aspect of data representation in mathematics. Through this activity, students will learn how to visually present data and analyze it to answer specific questions. This foundational skill is crucial as it aids in the interpretation of patterns and findings in data, facilitating critical thinking and decision-making based on statistical information.

In terms of content, the worksheet involves collecting data on different pets (birds, cats, dogs, and fish), which students then use to complete a pictograph. After creating the pictograph, students are tasked with analyzing it to determine which pet is favored the most and which pets are equally favored, enhancing their comparative and analytical skills.

The instructions are crafted considering the language proficiency and educational level of English-speaking students, making it straightforward and easy for them to follow. The worksheet tasks—collecting data, creating a pictograph, and analyzing the data—are clearly outlined in a step-by-step manner to ensure that students can proceed with minimal confusion.

As for subject relevance, this worksheet ties in seamlessly with the broader math curriculum, particularly in areas involving data management and analysis. The skills developed through this exercise are applicable in many other areas of mathematical study and everyday problem-solving, highlighting the practical application of math in real-world contexts.

The instructions provided are pivotal to structuring the worksheet's activities. "Collect the data" encourages students to engage actively with the collection process, giving them hands-on experience in gathering information, which is an essential part of data representation. "Complete the pictograph" then guides them to visually organize this data, fostering skills in graphical representation, which is a key element in statistics and other mathematical disciplines. Finally, the questions "Which pet is favored the most?" and "Which pets were favored equally?" direct students to delve deeper into analysis, pushing them to derive conclusions from the data represented in the pictograph.

By completing this worksheet, students harness not just their math skills but also enhance their ability to observe, interpret, and report on data about the world around them, showcasing the integral role of mathematics in understanding and navigating various aspects of life.
Advertisement | Go Ad Free
Pictograph
Advertisement | Go Ad Free