Member for
4 years 8 monthsAge: 5-10
Level: 1
Language: English
(en)
ID: 680999
31/01/2021
Country code: BS
Country: Bahamas
Main content: Pictographs (2011709)
From worksheet author:
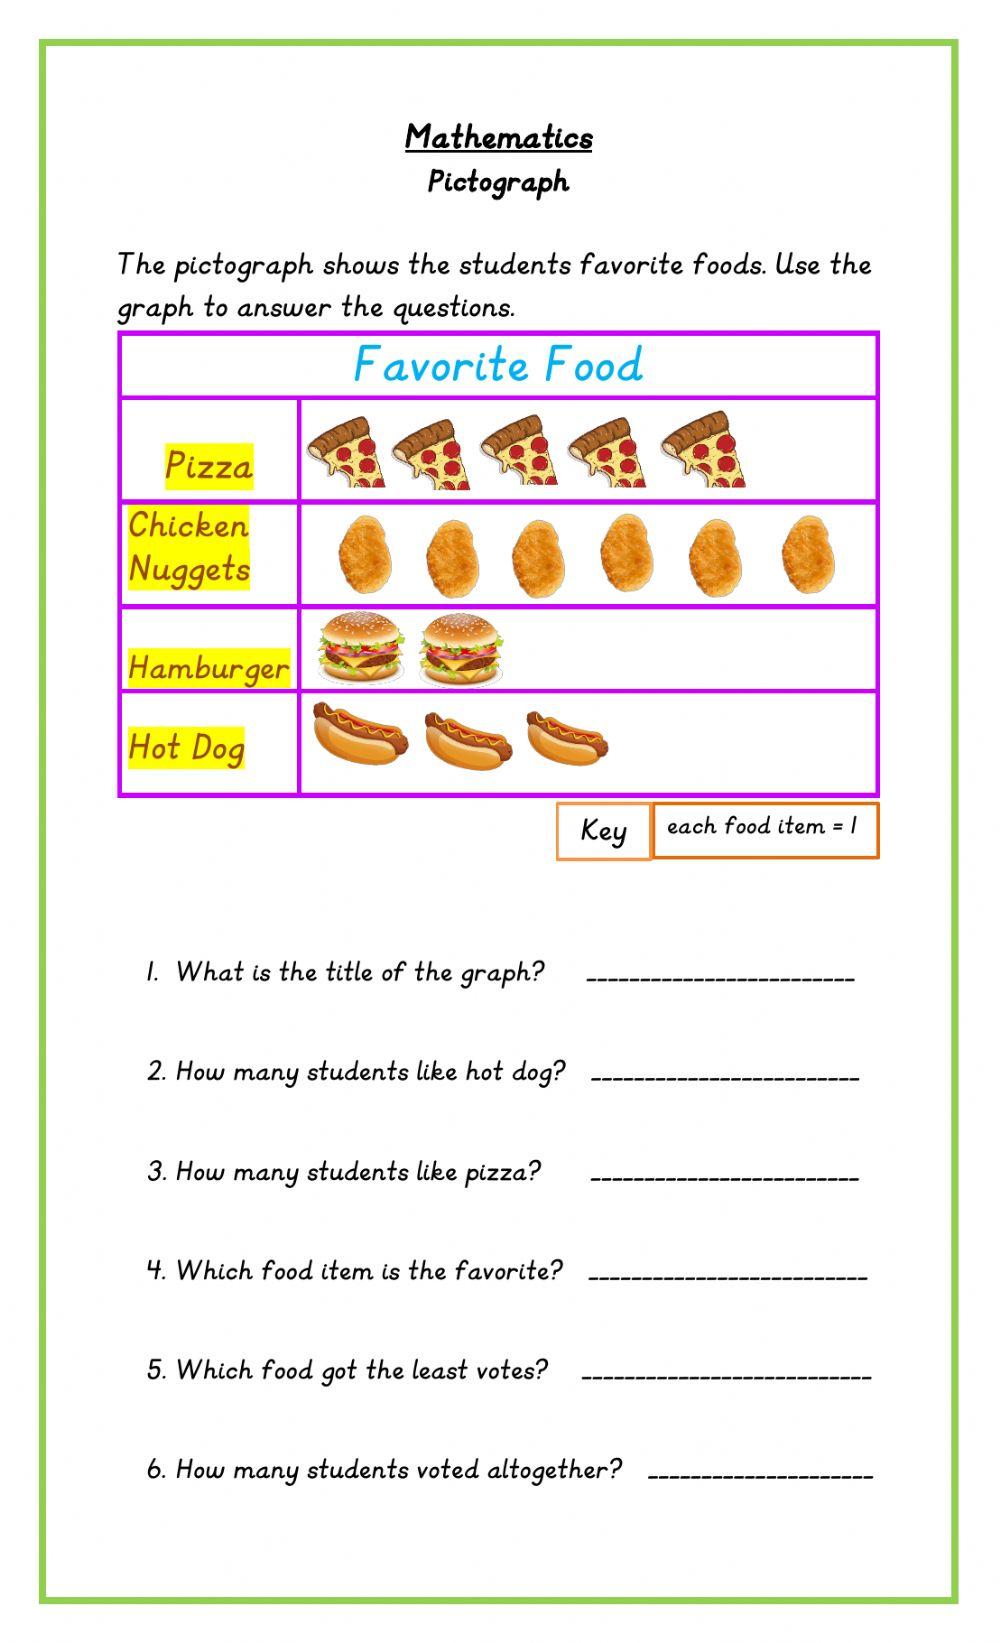
Pictographs about favorite foods
Other contents:
Word Problems
Worksheet description:
Objective:
This worksheet aims to help students understand and interpret data presented in pictographs. By analyzing the favorite foods of students, learners will practice reading and interpreting pictorial representations of data, enhancing their data literacy skills.
Content Overview:
The main focus of this worksheet is on pictographs, specifically depicting the favorite foods of students. Students will be asked to analyze the graph to answer questions related to the data presented, such as identifying the title of the graph, determining the most and least popular food items, and calculating the total number of votes.
Language and Educational Level Context:
Designed for students at the elementary level, this worksheet is presented in English to match the language proficiency of the target audience. The content is tailored to engage young learners in math concepts through visual data representation, making it accessible and engaging for students at this educational stage.
Subject Relevance:
This worksheet is directly related to the subject of Math, specifically focusing on data interpretation and analysis through pictographs. By engaging with this content, students will develop their skills in reading graphs, interpreting data sets, and drawing conclusions based on visual representations of information, all within the framework of mathematical concepts.
Instructions:
The instructions provided in the worksheet guide students on how to utilize the pictograph displaying students' favorite foods to answer a series of questions. The text prompts learners to analyze the graph by identifying the title, counting the number of students who like specific food items, determining the favorite food based on the data, identifying the least popular food item, and calculating the total number of votes. These instructions structure the tasks for students, helping them practice data interpretation skills in a guided and systematic manner.
Share / Print Worksheet
