New: Give students instant feedback with Practice Mode Learn how
Statistics
$1.99/month with a free account - sign up in seconds.
Most Popular
Newest
Oldest
A-Z
Z-A
Probability and Statistics - Math
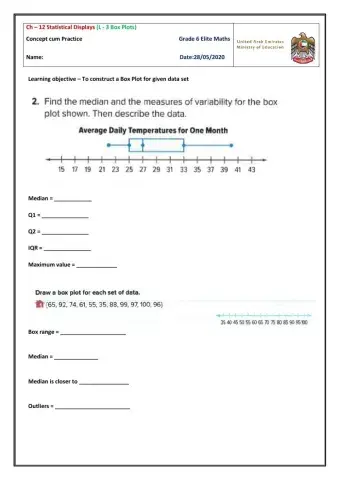
Constructing the Box plots
Addition and Subtraction - Math
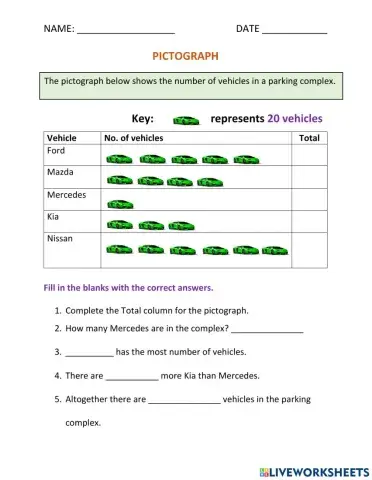
Read the Pictograph and answer the questions.
Math
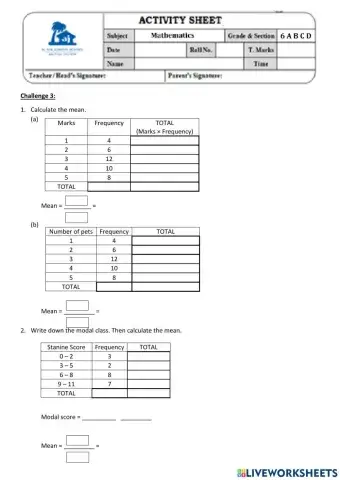
Find the mean and modal class.
interpreting two way tables
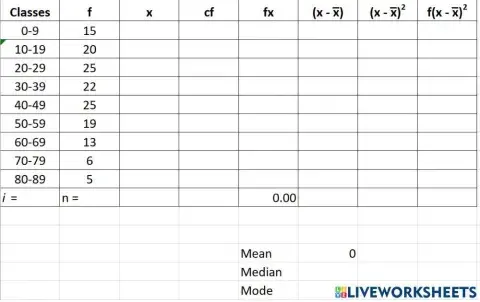
Use the standard deviation formula to data sets
Find the mean and missing numbers.
Completing and analyzing data from Pictographs
Calculate the mean from a frequency table. Write down the modal class of a grouped frequency table.
Statistics, frequency, graphics
Multiplication and Division - Math
Answer all questions.
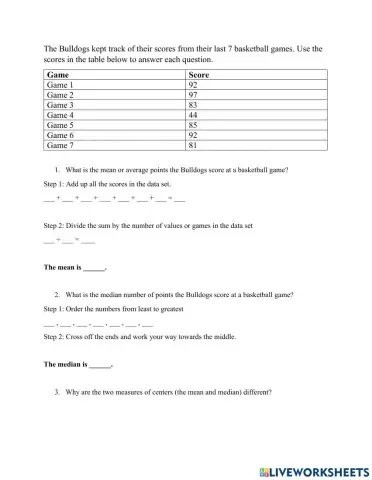
Find the mean and median of data set and explain the best measure of center
Fill in the missing values
find quartile decile and percentile using ogive
Frequency Tables
Fill in the blanks
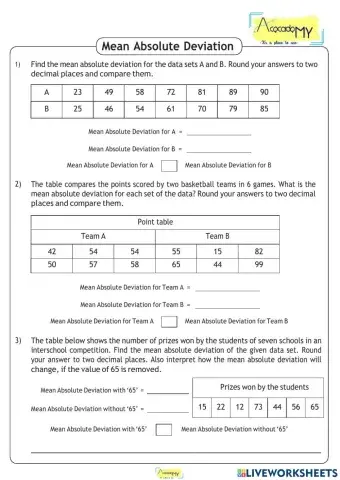
Find the MAD.
2 category dot plots
POST TEST
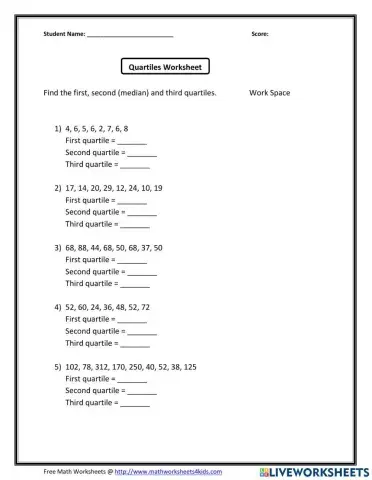
Study the quartiles
construct a frequency table
STATISTICAL MEASURES GRADE 6
Reading line graph
Activity Base Test - 2020 - 2021, for marks - 10
 Switch to New Search Page