


- Key price zones
- Previous Monthly High and Low
- Age 3+
-
level: Beginner
- English
Author's Instructions
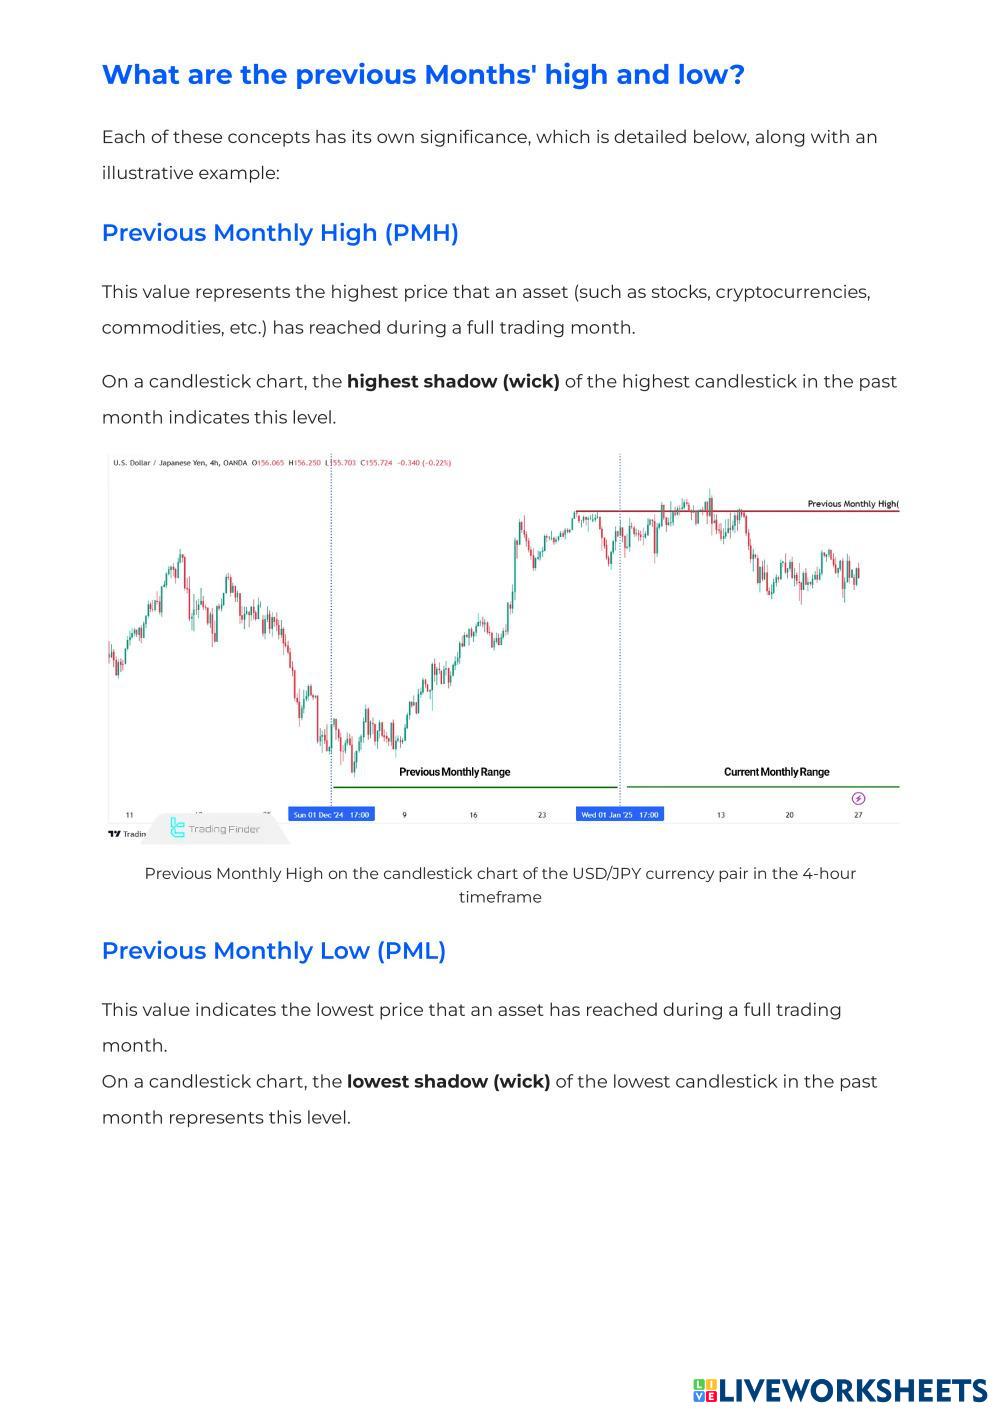
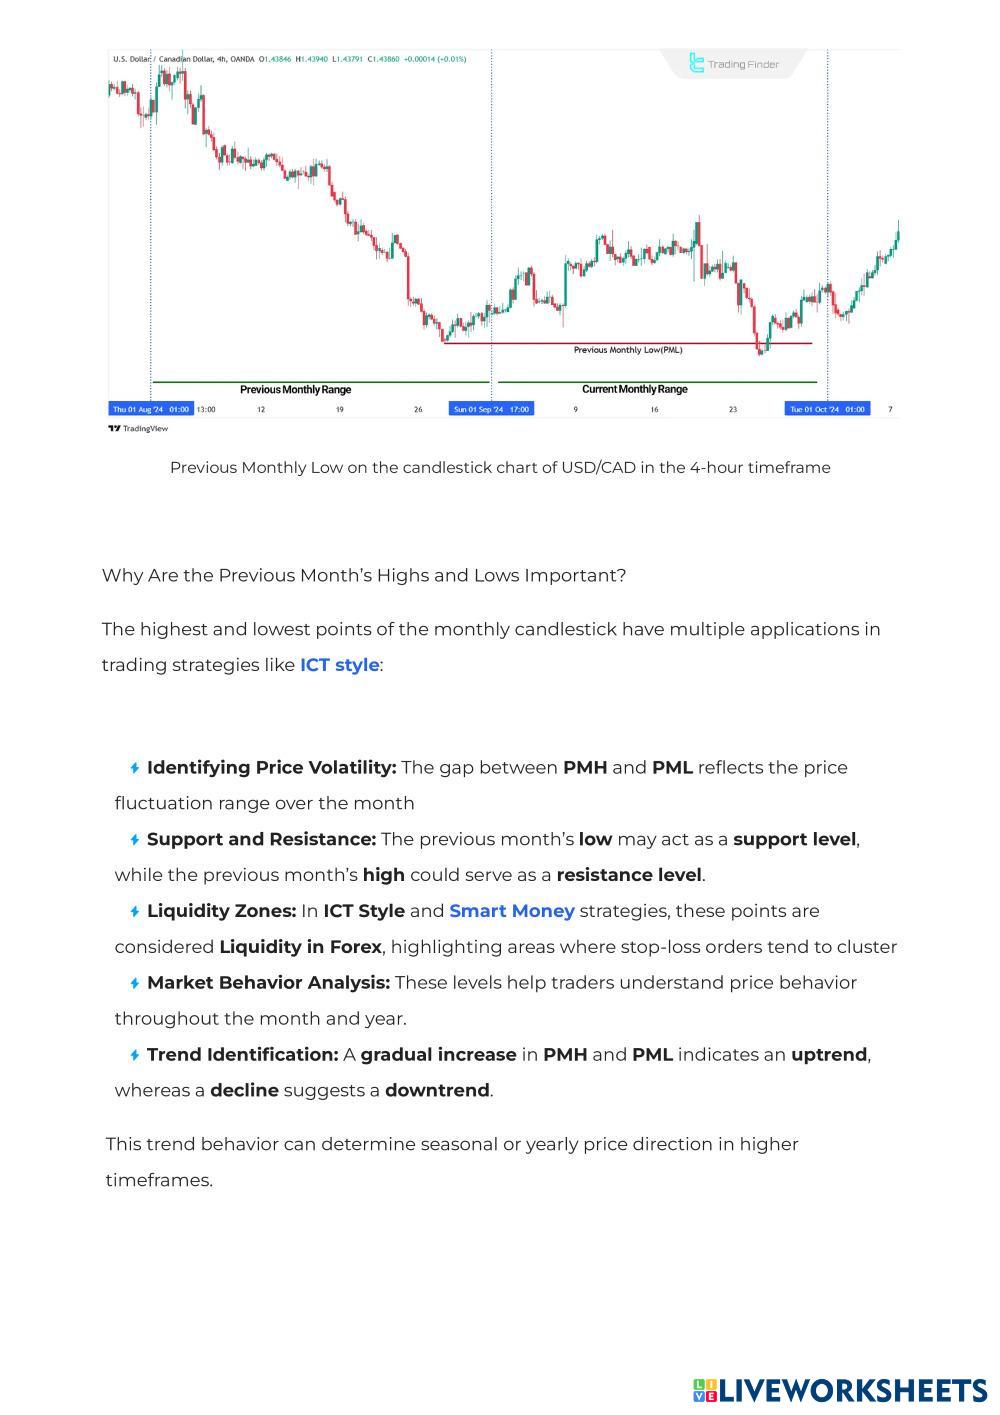
In technical analysis and price charts, the Previous Monthly High and Low (PMH & PML) represent the highest and lowest traded prices over the past month.
The Previous Monthly High (PMH) and Previous Monthly Low (PML) are essential data points for market analysts as they indicate price fluctuations over a monthly timeframe. The levels derived from them play a significant role in market trends.
My Google Classroom Courses

Quick Access
All Classes

Previous Monthly High and Low (PMH & PML); Key price zones


Author's Instructions
In technical analysis and price charts, the Previous Monthly High and Low (PMH & PML) represent the highest and lowest traded prices over the past month.
The Previous Monthly High (PMH) and Previous Monthly Low (PML) are essential data points for market analysts as they indicate price fluctuations over a monthly timeframe. The levels derived from them play a significant role in market trends.