อยากได้แบบฝึกหัดฟรีนับพัน (ไม่มีสิ่งรบกวนเลย)? Here’s how
Statistics
$1.99/เดือน ด้วยบัญชีฟรี — ลงทะเบียนได้ในไม่กี่วินาที
ได้รับความนิยมมากที่สุด
Newest
Oldest
A-Z
Z-A
Addition and Subtraction - Math
Using data to make tally charts or frequency tables
Multiplication and Division - Math
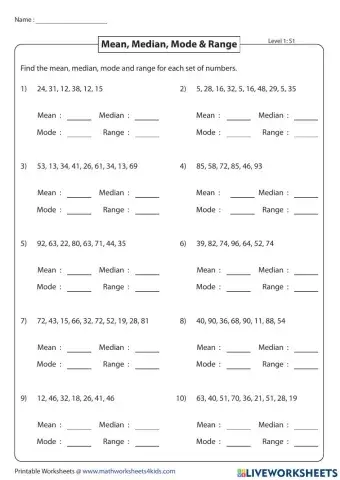
Mean median mode range
Math
Complete the worksheet.
Probability and Statistics - Math
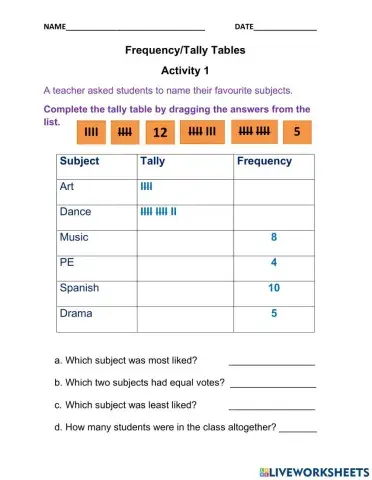
Frequency and Tally Tables
This is second review
Make the stem and leaf plot.
using a pictograph
Statistics Pictograph
most, least, same
Sorting and Making Tally/Frequency Tables
Interpreting Bar Charts
Calculating Mean mode median and range
Find the median and mode of the data given and also analyse the stem and leaf plots
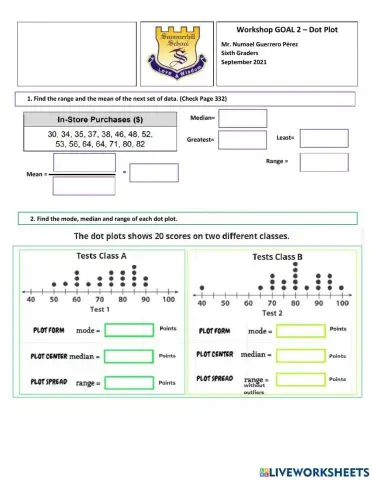
Workshop that evaluates Dot Plot analysis and comparing.
Math Quiz GRade 6
Line graphs - finding data
Finding mean, median, mode, and range
representing data using caroll diagram
Time and Money - Math
reading and interpreting data from timetables
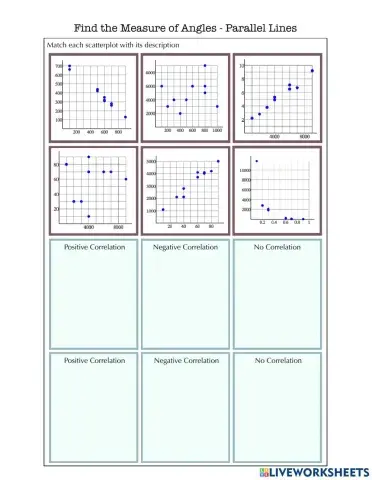
Scatterplots Matching Activity
dbhdhggdshdbbdkdh
construct a frequency table
Revision grade 3
reading and representing data on bar chart
 Switch to New Search Page