อยากได้แบบฝึกหัดฟรีนับพัน (ไม่มีสิ่งรบกวนเลย)? Here’s how
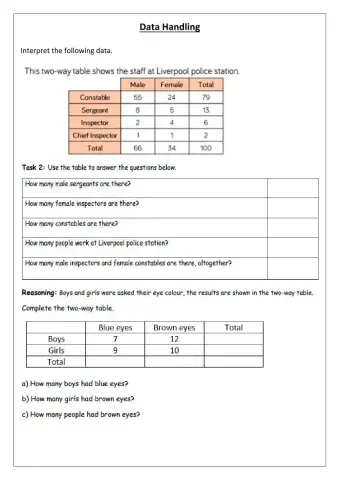
Data handling
ได้รับความนิยมมากที่สุด
Newest
Oldest
A-Z
Z-A
Math
Pupils need to calculate how to get the mode, range, median and mean. Then fill in the blanks.
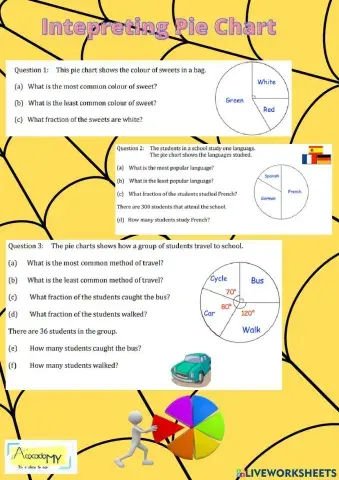
Interprets Pictographs and Bar Charts
To be able to read the table
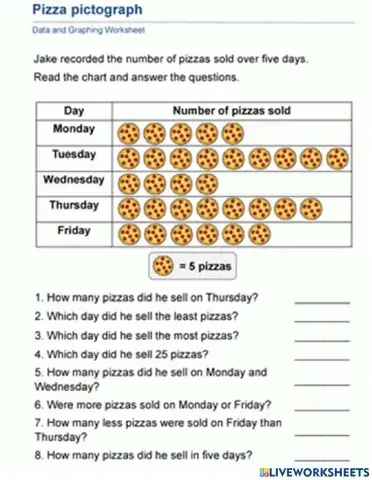
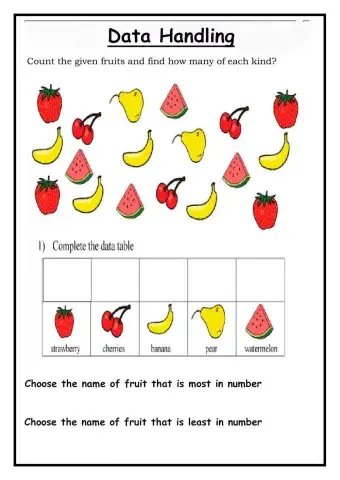
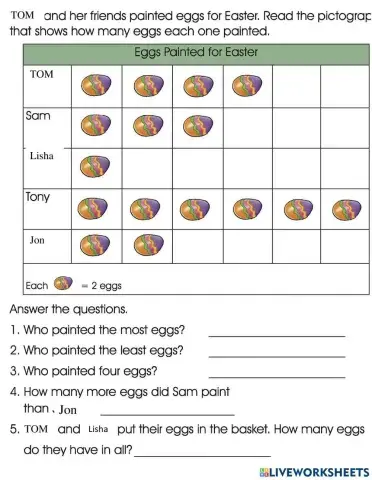
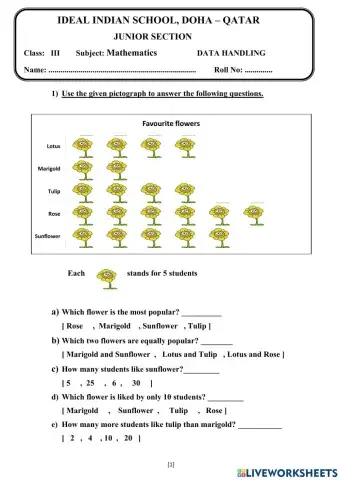
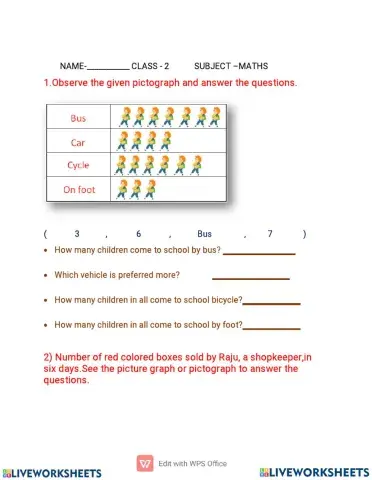
Read the pictograph and answer the questions
collect data
data Handling
Data handling- pictograph
Data handling-pictograph
Count the mean, median, mode and range for this data.
Finding the average/mean of given data
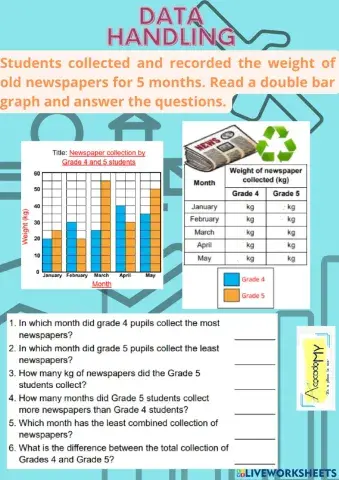
Analyze the data and complete the worksheet
Data Handling exercise for class 1 students
for students
Pupils need to calculate carefully and fill in answer only in the boxes.
Calculate the average
Solve this problem.
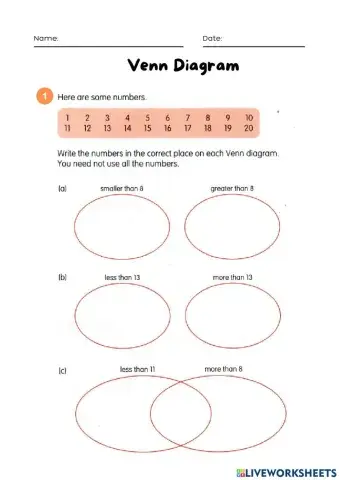
Venn diagram, data handling
NUMBER OF SHAPES IN SCENERY AND LETTERS IN NAMES
Data handling - pictogram for grade 2
a pictograph is a graph that shows numerical information by using picture symbols or icon s to represent data sets.
Pictograph uses pictures to represent the information
Count the data.
A worksheet to practice the data handling


 Switch to New Search Page