New: Give students instant feedback with Practice Mode Learn how
Statistics
$1.99/month with a free account - sign up in seconds.
Most Popular
Newest
Oldest
A-Z
Z-A
Addition and Subtraction - Math
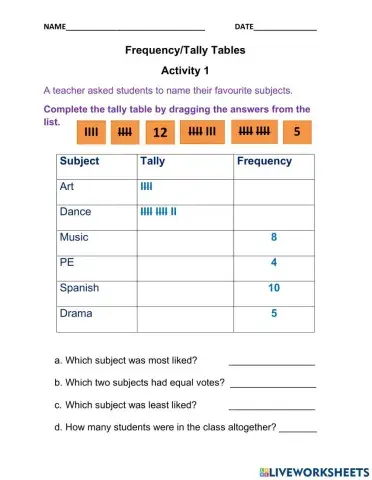
Using data to make tally charts or frequency tables
Multiplication and Division - Math
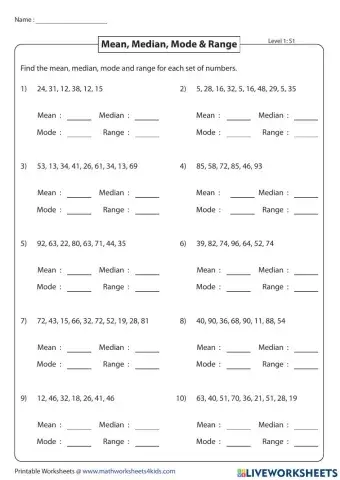
Mean median mode range
Math
Complete the worksheet.
Probability and Statistics - Math
Frequency and Tally Tables
This is second review
Make the stem and leaf plot.
using a pictograph
Statistics Pictograph
most, least, same
Interpreting Bar Charts
Calculating Mean mode median and range
Sorting and Making Tally/Frequency Tables
Find the median and mode of the data given and also analyse the stem and leaf plots
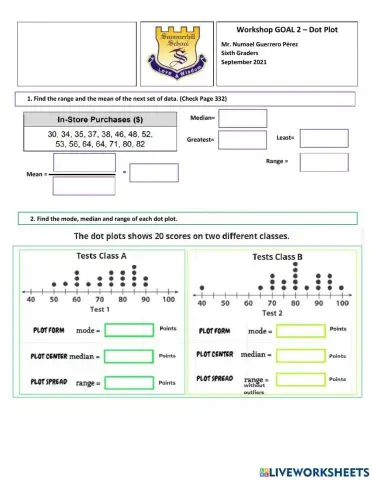
Workshop that evaluates Dot Plot analysis and comparing.
Math Quiz GRade 6
Line graphs - finding data
Finding mean, median, mode, and range
Time and Money - Math
reading and interpreting data from timetables
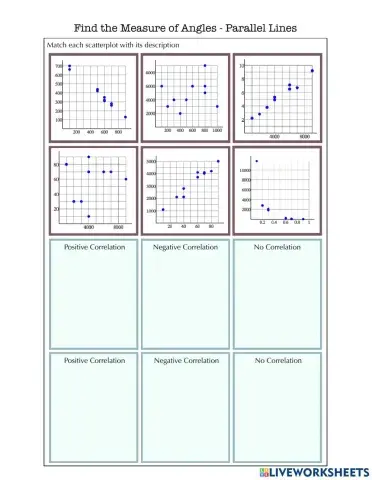
Scatterplots Matching Activity
representing data using caroll diagram
construct a frequency table
dbhdhggdshdbbdkdh
Revision grade 3
reading and representing data on bar chart
 Switch to New Search Page