New: Give students instant feedback with Practice Mode Learn how
Statistics
Most Popular
Newest
Oldest
A-Z
Z-A
Math
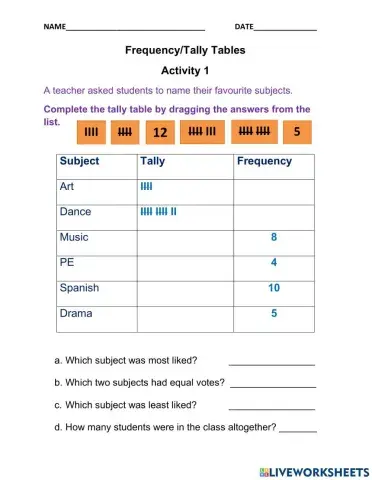
Using data to make tally charts or frequency tables
Frequency and Tally Tables
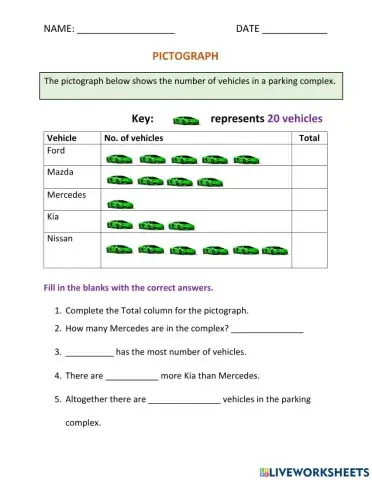
Statistics Pictograph
Sorting and Making Tally/Frequency Tables
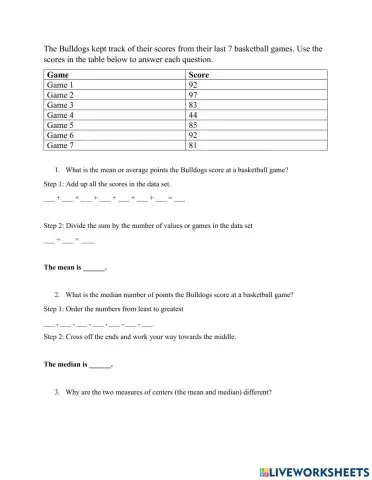
Calculating Mean mode median and range
Interpreting Bar Charts
Find the median and mode of the data given and also analyse the stem and leaf plots
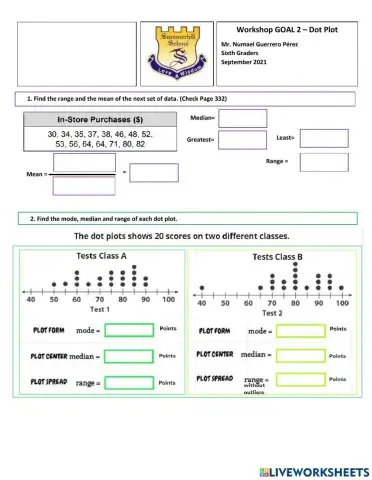
Workshop that evaluates Dot Plot analysis and comparing.
dbhdhggdshdbbdkdh
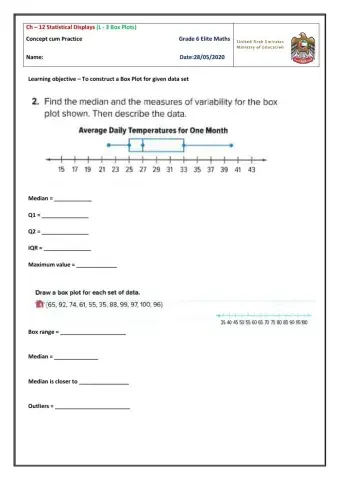
Constructing the Box plots
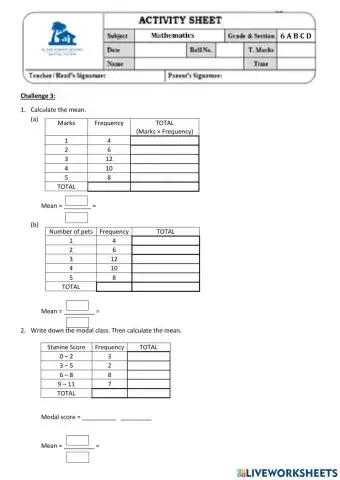
Find the mean and modal class.
Completing and analyzing data from Pictographs
Calculate the mean from a frequency table. Write down the modal class of a grouped frequency table.
Find the mean and median of data set and explain the best measure of center
POST TEST
Activity Base Test - 2020 - 2021, for marks - 10
ACTIVITY SHEETS
Measures of Position - Decile
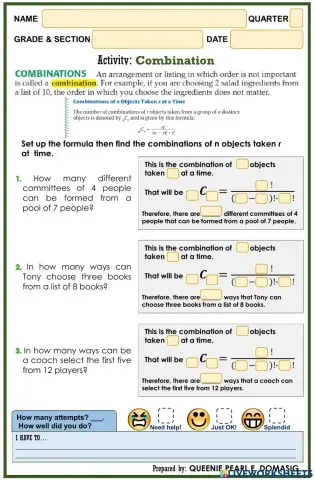
Combinations
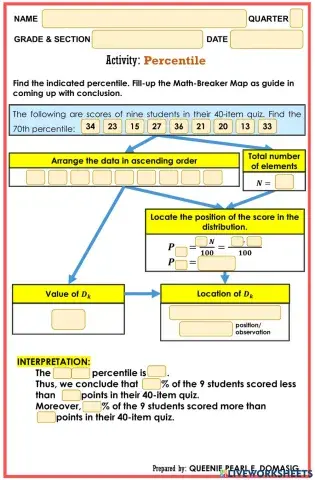
Measures of Position - Percentile
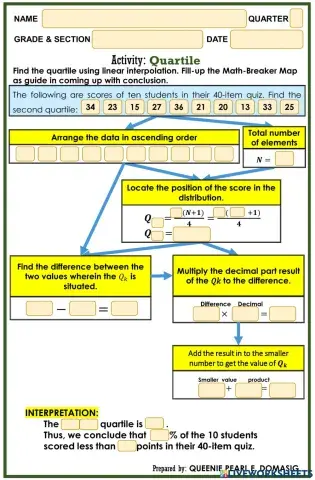
Measures of Position - Quartile
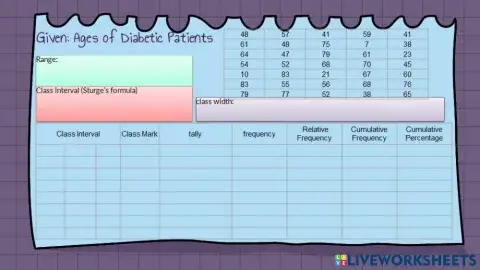
complete FDT
Select the data you want to do your project on and create a histogram graph and interpret the data.


 Switch to New Search Page