New: Give students instant feedback with Practice Mode Learn how
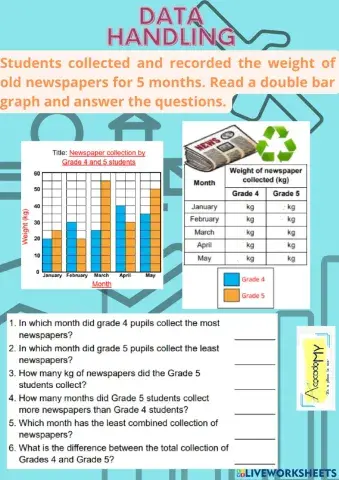
Data handling
Most Popular
Newest
Oldest
A-Z
Z-A
Math
Pupils need to calculate how to get the mode, range, median and mean. Then fill in the blanks.
Interprets Pictographs and Bar Charts
Count the mean, median, mode and range for this data.
Finding the average/mean of given data
for students
Pupils need to calculate carefully and fill in answer only in the boxes.
Calculate the average
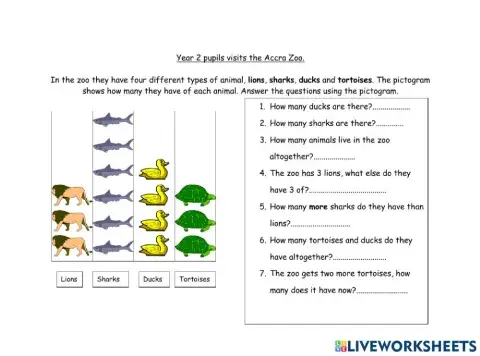
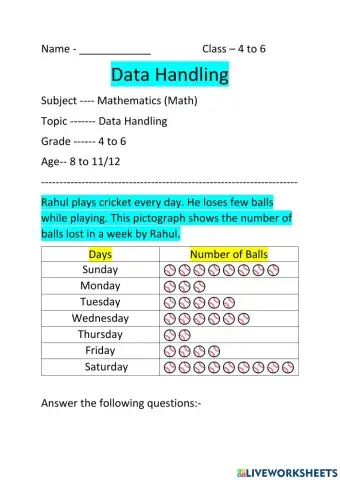
a pictograph is a graph that shows numerical information by using picture symbols or icon s to represent data sets.
Count the data.
pictogram in data handling
Find the solution
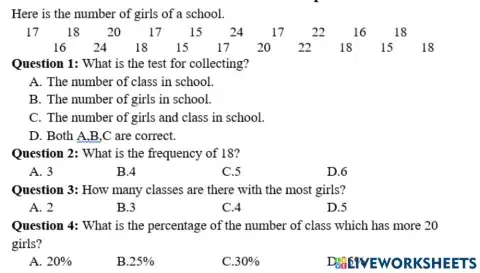
observe the graph and find out answers
INTERPRETATION OF PIE CHARTS (CONCEPT C.W.)
MULTIPLE CHOICE QUESTIONS
frequency table
fill in the blanks
Math worksheet
this is worksheet of data handling
ESTIMATION OF ANGLES (ADVANCED WORK)
INTERPRETATION OF BAR GRAPHS (ADVANCED WORK)
ANSWER ALL THE QUESTIONS
Data DataDataDataDataDataData
Math DATA HANDLING Practice Test For Grade 5 to 8


 Switch to New Search Page