Pictograph DJ

Age: 6-9
Level: 1
Language: English (en)
ID: 1559064
23/10/2021
Country code: BS
Country: Bahamas
School subject: Math (1061955)
Main content: Pictographs (2011709)
From worksheet author:

USE THE GRAPH TO ANSWER THE QUESTIONS

Other contents:
GRAPHS
Worksheet description:
Objective Explanation:
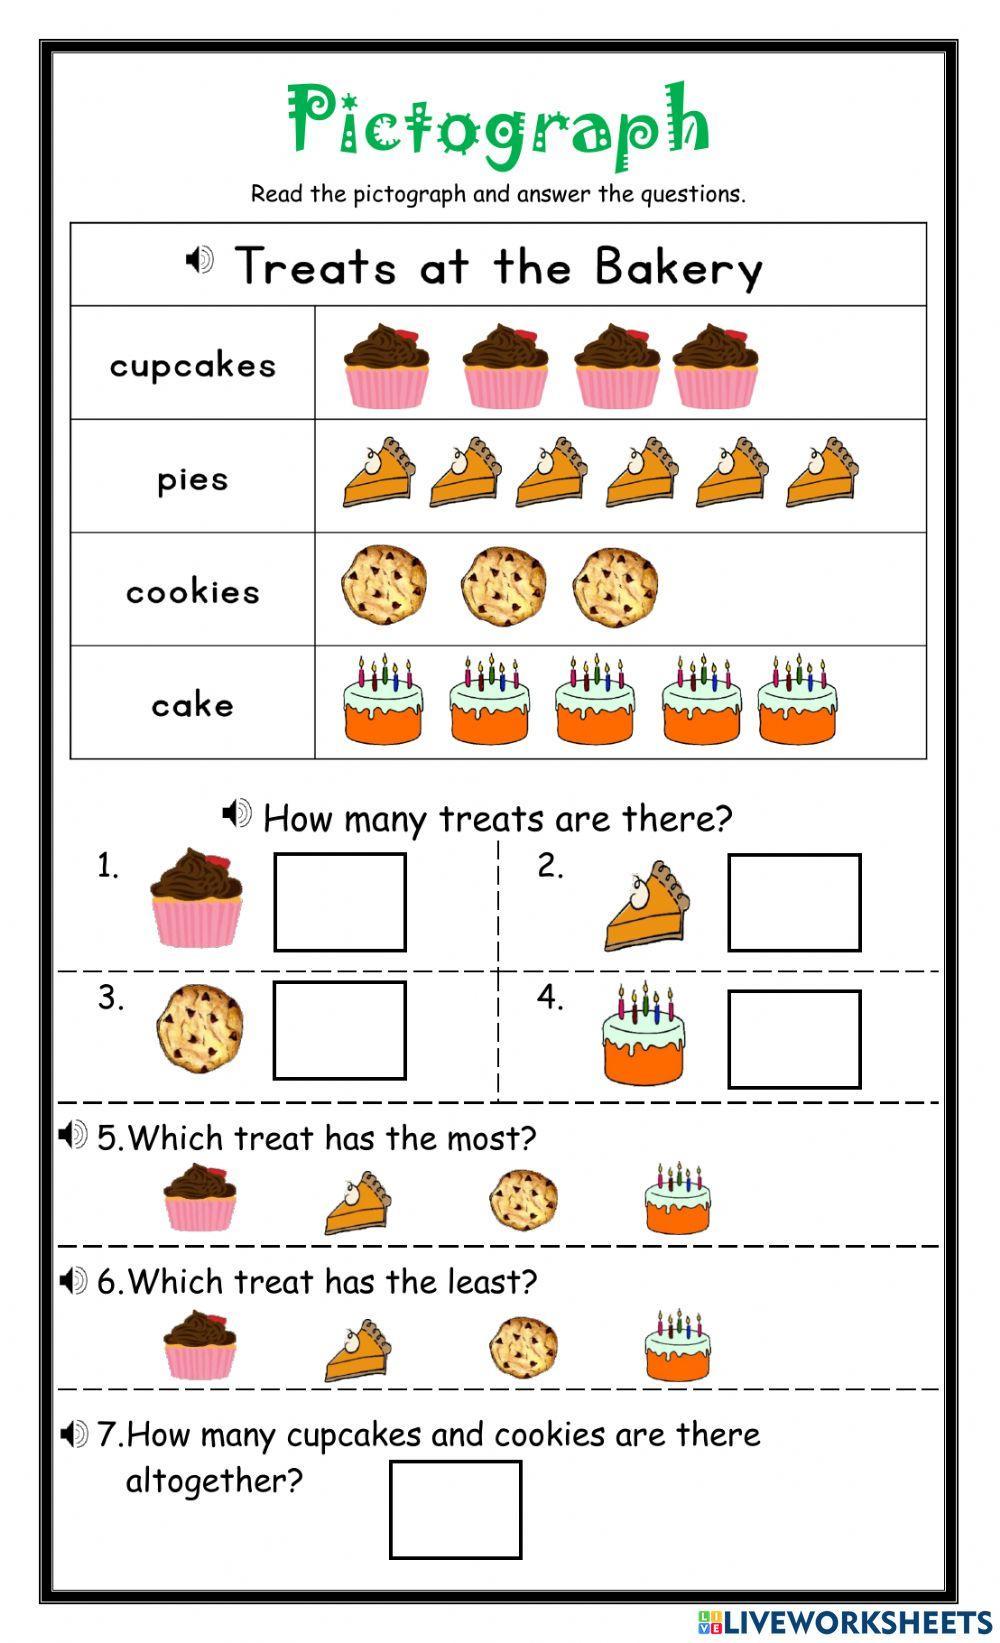
The objective of this worksheet is to enhance students' understanding of pictographs and their ability to interpret data presented in this visual form. By engaging with pictorial representations of data related to treats at a bakery, students will practice reading and analyzing the information to answer questions accurately.

Content Overview:
The main content of this worksheet revolves around pictographs, focusing on treats found in a bakery setting. Students will encounter images representing cupcakes, pies, cookies, and cake, alongside numerical data to be deciphered and compared. Through this exercise, students will develop skills in interpreting pictorial data and drawing conclusions based on the information presented.

Language and Educational Level Context:
Designed for students at an elementary level with English language proficiency, this worksheet is tailored to be accessible and engaging for young learners. The use of visual aids such as pictographs helps bridge language barriers and provides a hands-on approach to learning math concepts, making it suitable for students in the early stages of their education.

Subject Relevance:
Aligned with the Math curriculum, this worksheet integrates the concept of pictographs to reinforce data interpretation skills. By connecting abstract numerical data to visual representations, students can grasp the practical applications of math in real-world scenarios, such as analyzing treats at a bakery. This not only enhances their math skills but also cultivates critical thinking and problem-solving abilities.

Instructions:
The instructions provided in the worksheet guide students on how to approach the task at hand. By starting with a general prompt to read the pictograph and answer questions, students are directed to focus on the visual representation of treats at the bakery. The specific questions posed, such as determining the total number of treats, identifying the treat with the most and least quantity, and calculating the combined number of cupcakes and cookies, offer targeted practice in interpreting pictorial data and drawing comparisons. Through these instructions, students are encouraged to engage with the content effectively and develop essential math skills in data analysis.

Loading ad...

Pictograph DJ

Loading ad...