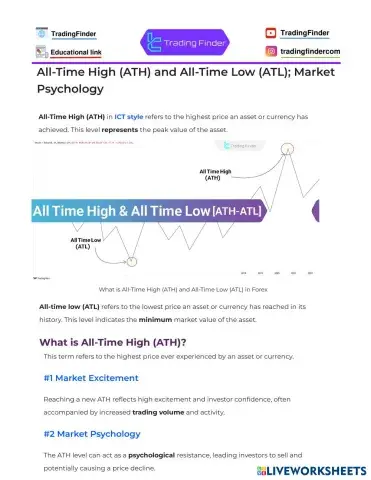
New: Give students instant feedback with Practice Mode Learn how
Math
Most Popular
Newest
Oldest
A-Z
Z-A
Calculus and Advanced Math Concepts - Math
The New York Kill Zone is divided into two segments.
Need indicators to identify Kill Zones? refer to the following links:
A Judas Swing in ICT trading refers to a deceptive price movement designed to mislead retail traders.
A heat map is a live visual tool that shows the performance of tradable assets in the forex market using two colors: green and red. TradingFinder's heat map is useful for identifying overall currency pair trends, recognizing asset correlations, and risk management.
The Candle Time Indicator enhances trading accuracy across various timeframes and strategies, including scalping.
With the Candlestick Time Indicator, traders can view the exact opening and closing times of candles directly on the price chart without manual calculations, allowing for more precise execution of the trading plan.
trading finder tools
ورقة عمل خاص بنشاط تحدي التكامل
Technology
Choose the True or False for the solution of Inverse Laplace transform by using first shifting theorem.
Please determine whether the function is even, odd or neither.
hhh
Solve the activity
u -substitution
There are two types of liquidity zones, and understanding them helps analyze future price trends.
Important Note: A stop loss for a Buy position is a Sell order, and a stop loss for a Sell position is a Buy order.
Internal liquidity is formed by Fair Value Gaps (FVG) and Order Blocks (OB).
These zones serve as temporary price equilibrium areas before the price moves toward external liquidity.
Stop Hunting in the ICT style refers to a scenario where the price triggers a stop-loss order with a shadow (wick) and then reverses direction toward the take-profit level. This phenomenon is also known as “stop-loss hunting.”
The ICT 2022 Mentorship trading strategy is uniquely designed based on the combination of market liquidity and precise timing.
Utilizing advanced tools such as the Fair Value Gap (FVG), Order Blocks, and Breaker Blocks, it enables traders to identify entry and exit points with high accuracy.
Find the Linearity of Laplace Transform
TradingView Tutorial helps traders in various financial markets such as crypto, Forex, stocks, symbols, etc. to get familiar with the most useful sections of this platform such as charts, indicators, drawing tools, Fibonacci, and more.
In financial markets like the currency market, there are people or companies that act as a link between you and the market.
In advanced technical analysis, Previous Weekly High and Low (PWH & PWL) refer to the highest and lowest price points a financial asset reached during the past trading week.
The levels are crucial in market structure analysis, identifying support and resistance levels, liquidity management, and determining optimal trade entry and exit points.
The scalping strategy in ICT style allows traders to capitalize on short-term market fluctuations by understanding liquidity raids and utilizing Optimal Trade Entry (OTE) setups. It can also enhance the accuracy of entry and exit points.
In the Forex market, Spread is the gap between the bid price (the buying price) and the asking price (the selling price) of a currency pair.
The Next Day Model (NDM) trading strategy in the Market Maker Buy and Sell (MMXM) ICT style focuses on analyzing and predicting price movements for the following day.