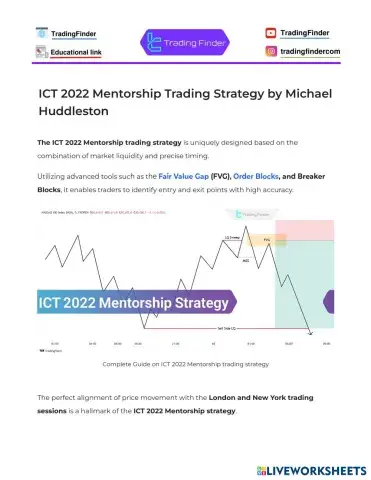
¿Quieres miles de fichas gratuitas (y cero distracciones)? Here’s how
2º de Bachillerato
Más popular
Newest
Oldest
A-Z
Z-A
Calculus and Advanced Math Concepts - Math
A heat map is a live visual tool that shows the performance of tradable assets in the forex market using two colors: green and red. TradingFinder's heat map is useful for identifying overall currency pair trends, recognizing asset correlations, and risk management.
Presupuesto de produccion
Geometry - Math
Kerjakan LKPD dibawah ini
Kerjakan latihan berikut
SELAMAT MENIKMATI BOSSS !!!
please drag and drop
Algebra - Math
-
Trigonometry - Math
.
jawablah pertanyaan dengan teliti
Silahkan kerjakan LKPD ini secara online tanpa menggunakan cara
Hoàn thành phiếu học tập
Ikuti setiap langkah-langkah pada LKPD untuk menentukan rumus luas permukaan dan volume bangun ruang sisi datar
The Candle Time Indicator enhances trading accuracy across various timeframes and strategies, including scalping.
With the Candlestick Time Indicator, traders can view the exact opening and closing times of candles directly on the price chart without manual calculations, allowing for more precise execution of the trading plan.
trading finder tools
Probability and Statistics - Math
Do it
Kegitan Belajar 4
Kerjakan bersama kelompokmu
Latihan
semangat
LKPD Kejadian Saling Bebas
FIGHTINGG GUYSS-!!!!!!
Untuk memudahkan siswa dalam memahami materi, belajar mandiri, dan latihan sebelum ulangan
YOK BISA YOK
#WATER IS GOOD
#LLOYED IS GOOD
#WATER IS LLOYED